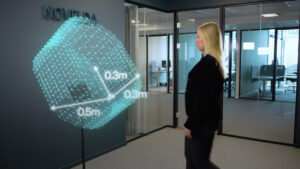
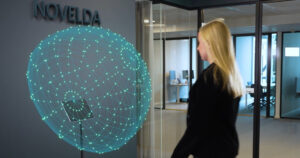
NOVELDA Ultra-Wideband Sensor is the world’s most reliable solution for human presence detection. The sensor can detect the tiniest movements, like breathing and heartbeat. This is useful for a variety of indoor applications, in consumer electronics devices, in smart building systems and for in-cabin sensing in automotive.
NOVELDA Ultra-Wideband Sensor enables new levels of user experience, increases safety, reduces energy consumption and can contribute in saving lives.
Groundbreaking innovation with endless potential
NOVELDA Ultra-Wideband Sensor is useful in a vast array of indoor applications and products.
In a laptop, the sensor detects your presence and will provide touch-free log-in when you approach. The sensor will continue to detect your presence based on small movements, like your breathing. The laptop stays on even when you sit still in front of it. When you leave, the laptop locks immediately, improving security and battery life. This takes user experience to the next level.
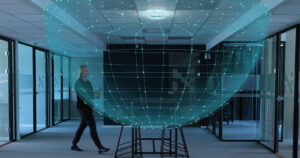
In an office, a hotel room or in your home the sensor will manage light, heating and air-condition depending on human presence. No energy is wasted when you are not there.
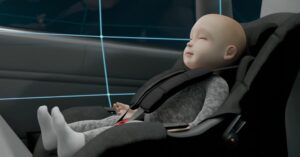
The sensor can even tell if you have forgotten your child in the car.
Customer benefits
Adding convenience
The device is ready when you are since the sensor knows your presence
Saving energy
The device is only used when you need it and is turned off when you leave
Improving security
The device is automatically logged off when you leave
Increasing safety
The sensor will detect even breathing and heartbeat
Ensuring wellbeing
Perfect temperature and lighting when you are in the room